 Coop Security

Map packs · ACT and surrounding NSW
A printed field-survey pack for your site, from one point on the map
Send a location and a plot size. You get site maps and plot plans drawn from 1 m LiDAR and aerial imagery, a randomised quadrat layout, field sheets that match it, and waypoints for your GPS.
Available for the ACT and surrounding NSW. Each pack is made to order and checked by a person.
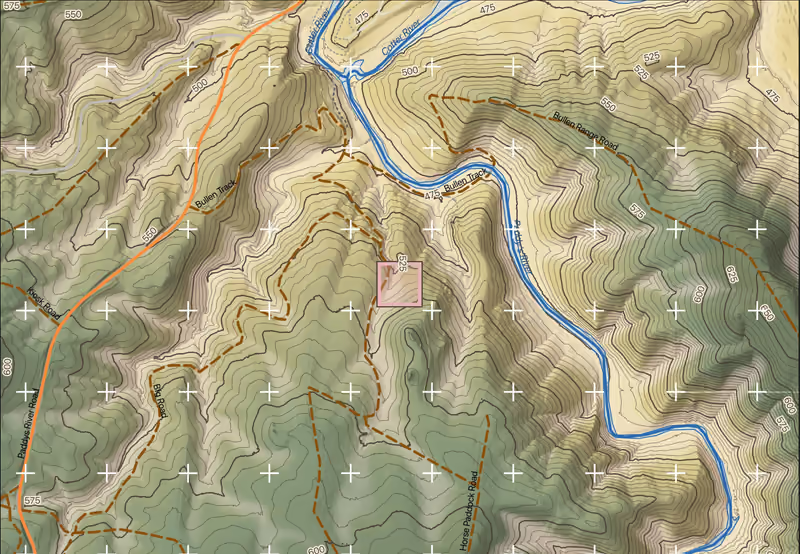
Sheet 04, Cotter – Paddys River: map face of the site map, topography, 5 m contours over LiDAR terrain. LiDAR © Australian Capital Territory and Aerometrex Limited, CC BY 4.0. Roads and rivers © OpenStreetMap contributors, openstreetmap.org/copyright. LiDAR 2015 © Australian Capital Territory, CC BY 4.0, modified
- Packs are planning and field-survey aids. They are not a land survey, an engineering design, a biodiversity assessment, or legal or regulatory advice.
- The cartographic styling and the compass are this project’s own work, inspired by Alphonse Mucha. They are not Aboriginal art.
How it works
From a point on the map to a pack you can print
-
Step 1: Send a point
Give us a coordinate in MGA zone 55 or latitude and longitude, a site name, the plot size in metres and what the pack is for. Or choose one of the public packs.
-
Step 2: We make the pack
We draw the maps from 1 m LiDAR terrain and canopy, geology and aerial imagery, and lay out two random draws of 1 × 1 m frames. A person checks every sheet before it goes out.
-
Step 3: You print and go
You get PDFs sized for A4 and GPX waypoints of the frame centres for your Garmin watch. Print the sheets, load the waypoints, walk to the first frame.
Field packs
Open a pack before you ask
Public packs for public land. Every sheet opens as a PDF; the zip with the GPX files needs a short request.
What is in a pack
Eight maps, four field sheets, one set of waypoints
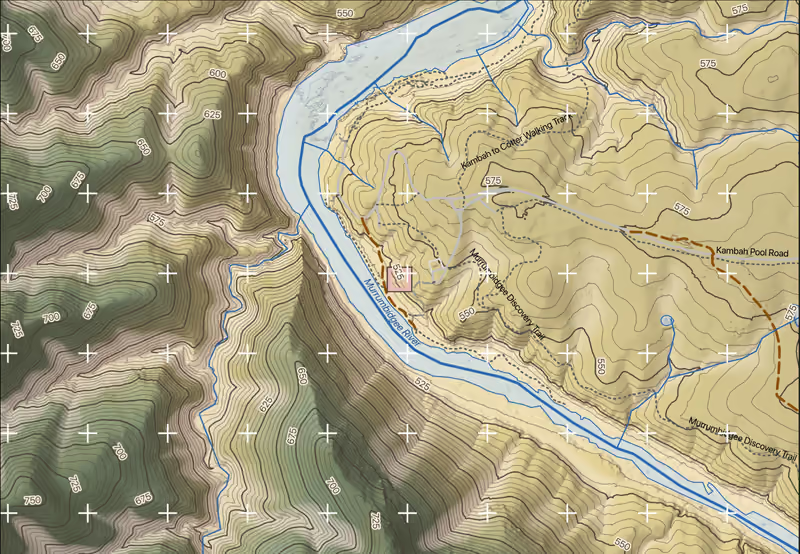
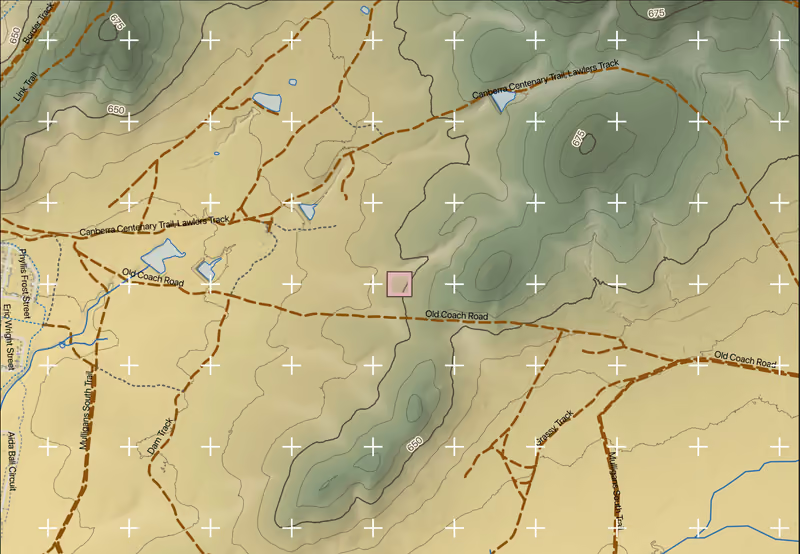
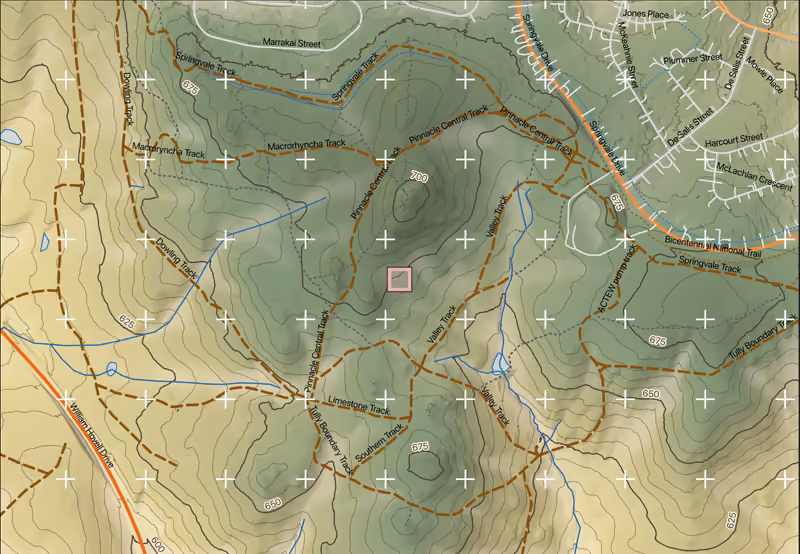
Every pack covers one site and one plot. The four site maps show the wider setting; the four plot plans show the plot itself, at a scale you can walk with. These are the pages of the Cotter sample.
Each sheet carries its own credits in the margin. Full credits for every sheet are on the licences page.
Site maps
4 sheets · A4 landscape · about 1:9,300


Plot plans
4 sheets · 11 and 14 A4 portrait, 12 and 13 A4 landscape · drawn to fit the plot


Every plan carries both draws of 1 × 1 m frames: stratified frames (filled) sample each canopy class, systematic frames (ringed) spread evenly over the plot. Each frame is labelled with its code.
Field sheets
05 and 06 A4 landscape · 07 and 08 A4 portrait


Sheet credits: LiDAR © ACT & Aerometrex 2020, CC BY 4.0 · Roads & rivers © OpenStreetMap contributors (ODbL)
Also in the pack: GPX waypoints of the frame centres for a Garmin watch, one file per draw; a README and an ATTRIBUTION.md with every credit; and a site report with the geology and terrain at each frame, mineral occurrences, the closed-canopy patches, plants recorded nearby and the data sources.
The maps are planning and field-survey aids. They are not a land survey, an engineering design, a biodiversity assessment, or legal or regulatory advice.
Who it is for
For people who walk the site
-
Field survey teams
Small ecological consultancies, assessors who want maps and random plot centres, university field courses, Landcare and catchment groups.
For example: a Landcare group monitoring a creek-line planting could load the frame centres onto a watch and walk straight to each frame on the first morning.
-
Researchers and students
A clean, credited study-site figure, and a plot layout you can describe in a methods section.
For example: a student could use the topography map as a study-site figure and cite the procedure sheet, with its seeds, for the plot design.
-
Landholders and land managers
A closer look at your block: the shape of the ground, the rock beneath it, and where the tall trees stand. Planning information, not a survey or an engineering design.
For example: a landholder could use the canopy maps to see where the tallest trees stand before planning a fence line.
What a pack is not: it is not a land survey, an engineering design, a biodiversity assessment or a species survey. We supply maps and plot layouts to the people who do that work.
Data and licences
Where the data comes from
Every sheet credits its sources in the margin. This is the full list, with the licence each one is used under.
Plant lists come from the Atlas of Living Australia. Records published under non-commercial licences are left out of paid packs.
The cartographic styling and the compass are this project’s own work, inspired by Alphonse Mucha. They are not Aboriginal art.
What the maps cannot tell you
- Geology is a statewide compilation, far coarser than a 1 m frame.
- The LiDAR shows the ground and trees as they were when it was flown.
- LiDAR cover is a foliage-cover measure, not crown cover.
- Contours from LiDAR are not survey levels.
- Nearby species records are indicative, never a complete list.
| Source | Used for | Licence |
|---|---|---|
| ACT Government LiDAR 2020 (12 points/m² point clouds, 1 m DEM)Australian Capital Territory and Aerometrex Limited | sampling strata (upper-stratum cover classes), canopy height model and cover, terrain products, maps 03, 04, 12–14 | CC BY 4.0Commercial use: yes |
| ACT Government LiDAR 2015 (4 points/m², 1 m DEM), gap fill under the 2020 captureAustralian Capital Territory (ACT Government, Environment and Planning Directorate) | LiDAR tiles where the 2020 capture has none (mosaicked under 2020) | CC BY 4.0Commercial use: yes |
| Copernicus GLO-30 digital surface model (tiles S36 E148, S36 E149)DLR e.V. (2010–2014) and Airbus Defence and Space GmbH (2014–2018), provided under COPERNICUS by the European Union and ESA | site-report terrain, locator-inset terrain on the site maps | Copernicus WorldDEM-30 licenceCommercial use: yes |
| ACT Aerial Imagery, current (7.5 cm; Dec 2025 full coverage + Mar 2026 urban), baked to MBTilesAustralian Capital Territory and Aerometrex | aerial imagery on map 02 and plan 11 (baked MBTiles) | CC BY 4.0Commercial use: yes |
| Surface Geology of Australia 1:1 000 000, 2012 edition (GA WMS, GetFeatureInfo)Commonwealth of Australia (Geoscience Australia) | GA 1:1M unit per frame in the site report | CC BY 4.0Commercial use: yes |
| NSW Seamless Geology v2.6 (rock units and faults)State of New South Wales (Geological Survey of NSW, Department of Primary Industries and Regional Development) | rock units and faults on map 01, plan 12 and in the site report | CC BY 4.0Commercial use: yes |
| GSNSW mineral occurrences (MinView, EarthResourceML mo:MinOccView)State of New South Wales (Geological Survey of NSW, Department of Primary Industries and Regional Development) | mineral occurrences on map 01 and in the site report | CC BY 4.0Commercial use: yes |
| OpenStreetMap roads, tracks, car parks, rivers and water bodies (Overpass extracts)OpenStreetMap contributors | roads, tracks, rivers and water bodies on the site maps and the inset; access in the site report | ODbL 1.0Commercial use: yes |
| Atlas of Living Australia occurrence download, ACT, 13 Aug 2026 (high-confidence subset)Atlas of Living Australia and its data providers (each record keeps its provider's licence) | species within 1,000 m in the site report; the About-this-site band | Per record (CC BY 4.0, CC BY-NC 3.0, CC BY-NC 4.0, CC0 1.0 …)Commercial use: conditional |
| Field records: frames, sheets, photos and observationsthe surveyors (the JIS project) | frames, sheets, photos and observations | Own workCommercial use: yes |
| Mucha-inspired cartographic styling and compass rosethe JIS project (original work) | map styling and compass rose | Own workCommercial use: yes |
Software: QGIS (LTR), with SpatiaLite (GPL 2.0 or later) · GDAL/OGR and PROJ (MIT) · PDAL (point cloud processing) (BSD 3-Clause).
Produced using Copernicus WorldDEM-30 © DLR e.V. 2010-2014 and © Airbus Defence and Space GmbH 2014-2018 provided under COPERNICUS by the European Union and ESA; all rights reserved. The organisations in charge of the Copernicus programme by law or by delegation do not incur any liability for any use of the Copernicus WorldDEM-30.
Sample pack
Cotter – Paddys River, ACT
The maps, sheets and waypoints a customer receives, for a public site at Cotter – Paddys River, in the Bullen Range Nature Reserve west of Canberra.
Open every sheet as a PDF, no form needed. The zip with the GPX files is free for academic use with a verified education email.
- 01–04 site maps: geology, aerial imagery, LiDAR canopy, topography4 PDF
- 11–14 plot plans: imagery, lithology, canopy cover, 0.25 m topography4 PDF
- 05–08 field sheets: datasheet, coordinates, point-intercept, procedure4 PDF
- Frame centres for a Garmin watch, one file per draw2 GPX
- README: the design, the frames and how to printMD
- ATTRIBUTION.md: every credit and licenceMD
Pricing
Four ways to buy
Introductory prices in AUD per site, reviewed quarterly. [GST included]. We confirm the price and the wait after checking coverage for your point.
-
Academic and non-commercial
Free with a verified education email
Teaching, student projects and non-commercial research. The pack carries academic attribution.
Ask about your site -
Landholder
$95 per site
Your own block, for personal use: planning works, briefing contractors, knowing the ground.
Ask about your site -
Professional and commercial
$350 per site
Consultants, agencies and publications for profit. Commercial attribution, with CC BY-NC species records left out.
Ask about your site -
Custom
Quote in writing
More sites, larger areas or repeat visits. Tell us what you need and we quote before any work starts.
Ask for a quote
Turnaround: about 3 working days where we already hold the 1 m LiDAR for your site, about 10 where it must first be ordered from ELVIS. The request form shows which applies to your point. Nothing is charged until you accept the price.
Included
- Four A4 site maps and four A4 plot plans
- A randomised layout of 1 × 1 m frames, stratified by LiDAR canopy class with proportional allocation, plus a systematic draw, seeds recorded
- Field datasheet, coordinate, point-intercept and procedure sheets
- GPX waypoints for a Garmin watch
- A site report
- Corrections after delivery: [to confirm]
Not included
- Uploading your own data or boundaries
- Analysis of the data you collect
- Any regulatory assessment or advice
- Sites where no 1 m LiDAR exists
Where do you cover?
The ACT and the parts of surrounding NSW where we hold 1 m LiDAR. If your point is outside that, the request form checks it and says whether the LiDAR can be ordered from ELVIS first, and how long that adds. Send it anyway and we will tell you plainly whether we can make a pack.
What does plot size mean?
The width and height in metres of the rectangle you will survey, centred on your point. Its corner is snapped to a 5 m grid, so the centre can move by up to 2.5 m. The frames are placed inside it, and the plot plans are drawn to fit it on A4.
The frames are 1 × 1 m quadrats, and each draw places 12 unless you ask for another count or a minimum spacing between frames.
How is the random layout made?
We divide the plot into cells and class each one as open, partial or closed canopy from the 2020 LiDAR. Frame centres are drawn at random within each class, in proportion to its area, with at least two in any class present. A systematic draw, spread evenly over the plot from a random start, is made alongside. The seeds are printed on the procedure sheet, so the layout can be reproduced.
The surveyor does not choose where to sample, which guards against selection bias. Moving or skipping frames in the field brings it back.
Which datum do you use, and will it work with my GPS?
Maps and coordinate sheets use GDA2020, with the MGA zone 55 grid. The GPX files are in latitude and longitude and load onto a Garmin watch. If your coordinate is in GDA94, say so.
How accurate are the maps?
Geology is a statewide compilation, far coarser than a 1 m frame. The LiDAR shows the ground and trees as they were when it was flown: 2020, with 2015 filling any gaps. LiDAR cover is a foliage-cover measure, not crown cover. Contours from LiDAR are not survey levels. Nearby species records are indicative, never a complete list.
What do I need in the field?
An A4 printer (card for the datasheet), a GPS or watch that takes GPX files, and a 1 × 1 m frame.
Can I use the maps in a report or for paid work?
Yes. Keep the credit lines printed on each sheet, and put the figure credit in the caption of any map image you reproduce: the data licences require it, and a reference alone is not enough. Each pack's page has both, ready to copy. Plant records under non-commercial licences are left out of packs for commercial use.
How long does it take?
About 3 working days where we already hold the LiDAR for your site, and about 10 where it must first be ordered from ELVIS. The request form shows which applies to your point. If you have a survey date, tell us and we will say whether we can meet it.
Do I upload anything?
No. One point, a site name and a plot size are all we need, or the name of a pack that already exists. A person makes and checks each new pack; nothing is generated by the website.
What is a pack not?
It is a set of field maps and sheets. It is not a land survey, an engineering design, a biodiversity assessment, a species survey, or legal or regulatory advice, and we do not analyse the data you collect.
Request
Ask about your site
Nothing is generated automatically. A person reads every request and replies by email.
What happens next
- Choose an existing pack, or send a point and a plot size for a new site. The form shows the expected wait.
- We email you a link: open it and press Confirm. For a new site, the person making the pack then replies with the price.
- Once that is settled, you get a download link for the pack.
Prefer email? Write to [email protected].
Prices: academic free, landholder $95, commercial $350 per site, [GST included]. See pricing.
Request received
Questions meanwhile: [email protected]